Alătură-te comunității noastre!
Vezi cele mai recente știri & informații din piața de capital

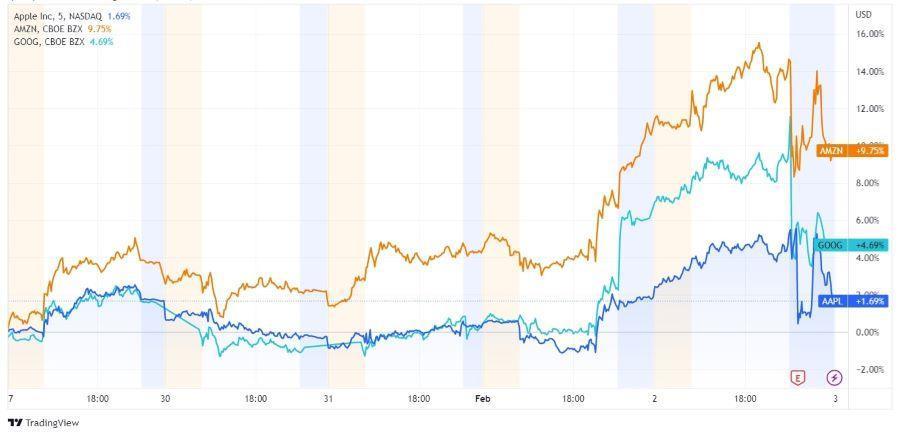
Annual and quarterly financial reports from major technology companies listed on NYSE have negatively disappointed Wall Street and show a further slowdown.
Despite a festive quarter in most business segments, the mega-techs failed to beat analysts’ expectations overall. With a slowing economy and weaker consumer sentiment, it seems that a ‘disinflationary’ 2023 could be a challenge for Silicon Valley giants.
Apple reported revenue of $117.2 billion for the December quarter, down 5% year over year. The company set all-time revenue records in a number of markets, including Canada, Indonesia, Mexico, Spain, Turkey, and Vietnam, along with quarterly records in Brazil and India.
A number of factors had a significant impact on Apple’s results including a very difficult foreign exchange headwind, macroeconomic environment and significant supply shortages for iPhone 14 Pro and iPhone 14 Pro Max in November and through December.
Financial highlights
• Revenue $117.15 billion vs. $121.14 billion forecasts
• Earnings per share (EPS): 1.88 vs. 1.94 forecasts
• Iphone revenue: $65.78 billion vs. $68.3 billion forecasts
• MacBook revenue: $7.74 billion vs. $9.72 billion forecasts
• iPad revenue: $9.4 billion vs. $7.78 billion forecasts
• Total product revenue $96.39 billion vs. $98.98 billion forecasts
• Revenue in China: $23.91 billion vs. $21.8 billion forecasts
• Home and accessories: $13.48 billion vs. $15.32 billion forecasts
iPhone sales were $65.8 billion, down 8% vs. record Q1 2022 although it’s worth taking into account that in Q4 the company struggled with the closure of a key ‘iPhoneCity’ factory in Zhengzhou, China, which affected shipments and production.
Higher revenues from iPads manufactured not only in China, but also in Vietnam indicate that the ‘covid-zero’ policy may have taken a ‘one-time’ toll on iPhone sales, smartphones still don’t have geographically diversyfied production.
However, higher-than-expected revenue from China may indicate that the Chnese opening economy will become an increasingly important market for Apple.
The company returned over $25 billion to shareholders during the December quarter, on strong cash flow evolution. This included $3.8 billion in dividends and equivalents and $19 billion through open market repurchases of 133 million Apple shares.
Apple ended the quarter with $165 billion in cash and marketable securities.
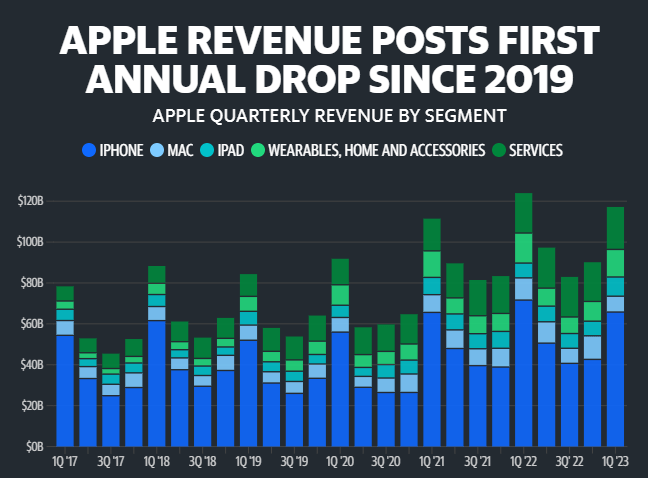
Apple reported its first year-over-year revenue decline since 2019. Although iPhone revenues were close to Q4 2021, they failed to beat Q1 2022 despite the debut of the new iPhone 14 and the holiday quarter. Source: Statista, Yahoo Finance
Net sales increased 9% to $149.2 billion in the fourth quarter, compared with $137.4 billion in fourth quarter 2021. Excluding the $5.0 billion unfavorable impact from year-over-year changes in foreign exchange rates throughout the quarter, net sales increased 12% compared with fourth quarter 2021.
Operating income decreased to $2.7 billion in the fourth quarter, compared with $3.5 billion in fourth quarter 2021. Fourth quarter 2022 operating income includes approximately $2.7 billion of charges for changes in estimates related to self-insurance liabilities, impairments of property and equipment and operating leases, and estimated severance costs. These charges primarily impacted the North America segment.
Net income decreased to $0.3 billion in the fourth quarter, or $0.03 per diluted share, compared with $14.3 billion, or $1.39 per diluted share, in fourth quarter 2021. Fourth quarter 2022 net income includes a pre-tax valuation loss of $2.3 billion included in non-operating income (expense) from the common stock investment in Rivian Automotive, Inc., compared to a pre-tax valuation gain of $11.8 billion from the investment in fourth quarter 2021.
Financial highlights
• Revenue: $149.2 billion vs. $145.8 billion
• Earnings per share (EPS): $0.03 vs $0.17 forecasts
• Cloud computing (AWS) revenue: $21.38 billion vs $21.76 billion forecasts
• Operating profit: $2.7 billion vs. $2.51 billion forecasts
• Operating margin: 1.8% vs. 1.85% forecasts
• E-commerce sales: $64.53 billion vs. $65.03 billion forecasts
• Estimated operating profit in Q1 2023: 0 to $4.0 billion vs. $3.52 billion forecasts
• Estimated Q1 2023 revenue: $121 to $126 billion vs $125.55 billion forecasts
First Quarter 2023 Guidance
Net sales are expected to be between $121.0 billion and $126.0 billion, or to grow between 4% and 8% compared with first quarter 2022. This guidance anticipates an unfavorable impact of approximately 210 basis points from foreign exchange rates. Operating income is expected to be between $0 and $4.0 billion, compared with $3.7 billion in first quarter 2022. This guidance assumes, among other things, that no additional business acquisitions, restructurings, or legal settlements are concluded.
Q4 2022 consolidated revenues were $76 billion, up 1% year over year, or up 7% in constant currency, and $283 billion for the full year 2022, up 10%, or up 14% in constant currency.
The weaker earnings are mainly due to the weak advertising sector. A recent investment bank Cowen research indicated that ad spending will fall twice in 2023 compared to 2022, and 2/3 of advertisers are factoring recession into their budgets meaning Google’s revenues can continue to fall until recesson fears persist. Cloud computing revenues, while slightly beating expectations, are clearly slowing.
In January 2023, the company announced a reduction of workforce of approximately 12,000 roles and expects to incur employee severance and related charges of $1.9 billion to $2.3 billion, the majority of which will be recognized in the first quarter of 2023.
Q4 net income came at $13.62 billion down 34% while annual net income came at $59.97 billion down 21%.
Financial highlights
• Revenue: $76.05 billion vs. $76.53 billion forecasts
• Earnings per share (EPS):$1.05 vs. $1.20
• Advertising revenue: $59.04 billion vs $60.64 billion forecasts
• Google cloud revenue: $7.32 billion vs $7.3 billion forecasts
• Youtube revenue: $7.96 billion vs $8.27 billion forecasts
• Services revenue: $67.84 billion vs $68.9 billion forecasts
• Other revenues: $8.80 billion vs $8.14 billion forecasts