Alătură-te comunității noastre!
Vezi cele mai recente știri & informații din piața de capital

In 1934, Benjamin Graham and David Dodd identified value as an equity investment style. Their then-revolutionary idea was that investors could buy stocks that were undervalued, based on their intrinsic value, and then wait for the market to recognize its “correct” price. A glance at value’s recent history, however, raises the question: Are value’s glory days over?
As shown below, value’s underperformance relative to the broad U.S. market over the past decade has hurt both index-based and active strategies.
The MSCI USA Enhanced Value Index — a proxy for index-based value strategies — has limped through the past decade ending Sept. 30, 2019, when compared to the broad market MSCI USA Index.
It underperformed the broad market index by 7 percentage points on a rolling 10-year basis. The median domestic value mutual fund faced similar headwinds. Meanwhile, a relative factor neophyte — momentum (represented by the MSCI USA Momentum Index) — sprinted to a 30% cumulative outperformance since 2010.
Here we diagnose the past two decades of the value factor through the lens of MSCI equity risk models around the world. Model factor returns can be particularly helpful as they are designed to be “pure” and aim to neutralize exposure to all non-target factors. As we’ll see, the value premium was down but not out, and in fact persisted in most regions outside the U.S. Even within the U.S., performance varied by sector.

Returns for the MSCI USA Enhanced Value and Momentum indexes are gross in USD. Returns for U.S. value managers are sourced from eVestment. Data was used only for those managers classified as mutual funds and with continuous monthly returns from 2010 to 2019.
Value around the globe
First, we explored whether value has declined in lockstep around the world and found that the performance of value has been very nuanced.
The exhibit below shows factor returns across several regions for different definitions of value, since 2000. Compared to the decade from 2000 to 2009, most of the fall was in earnings yield — the ratio between a company’s earnings per share for the last 12 months and its current stock price — as opposed to the book-to-price factor – the ratio between a company’s book value per share and its current stock price.
Only in the U.S. did the return for earnings yield turn negative. In China, the earnings yield return improved over the past decade, and dividend payers in the emerging markets generally weathered the 2010s well.
Why have there been such wide differences between book-to-price and earnings yield? Book values are backward-looking and driven by a firm’s return on equity. Earnings yield, as defined in MSCI risk models, contains both historical and forward earnings expectations.
The latter were high only for growth companies, as investors chased recent winners and bid up growth-oriented companies from specific industries, overlooking their valuations or earnings expectations. This focus on growth has largely left the earnings yield factor ignored.

Factor returns are annualized. Earnings yield is part of the book-to-price factor in the Australian equity risk model. Dividend yield is part of the book-to-price factor in the Japanese equity risk model.
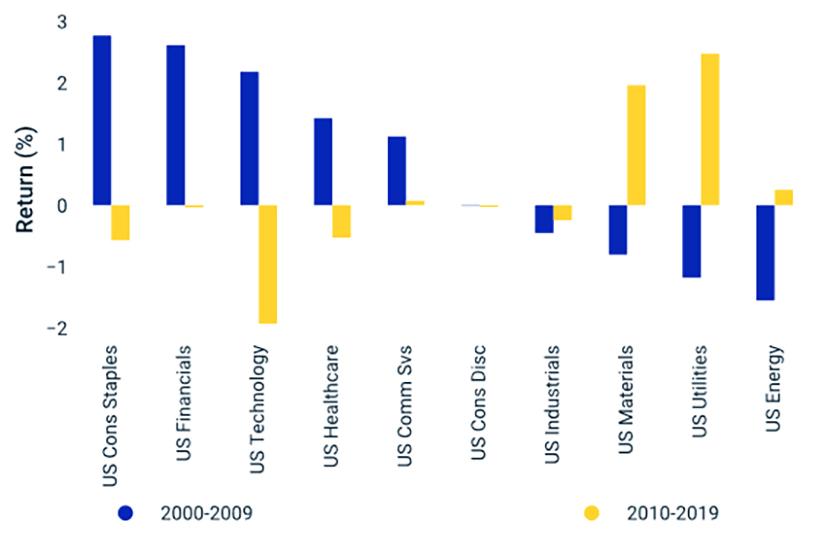
The decline in the U.S. was the outlier among the other regions. The next exhibit compares the value factor’s behavior in the U.S. across sectors, using MSCI’s U.S. sector risk models.3
Again, the fall in value from the 2000s to the 2010s was not consistent across market segments. During that time, value’s return flipped from positive to negative in consumer staples, technology and health care. Despite the falloff in the largest sectors, we found positive performance in materials, utilities and energy stocks.
U.S. equity sector models correspond to the Global Industry Classification Standard (GICS®) sectors, jointly developed by MSCI and Standard & Poor’s. Each sector model is estimated only from the constituents in that sector.
Software might not be eating the world, but it certainly snacked on value
The drop-off of value in the U.S. technology sector was stark compared to other sectors. Among all industries within technology, the high-performing — but expensive and thus underweight — software and services industry was the largest detractor to performance in the MSCI USA Enhanced Value Index during the study period.
Marc Andreessen noted in 2011 that “Software is eating the world.” While we can’t judge software’s dietary habits, there is ample evidence that software was a principal reason for the decline in value in the U.S.
We trace the software and services industry’s active exposures to two value factors (book-to-price and earnings yield), along with the growth, profitability and momentum factors over the past decade.5
The book-to-price and earnings yield exposures indicate the industry looked consistently over-priced, and became more expensive on an earnings basis as the period went on.

Then again, software and services was significantly, and consistently, more profitable than the rest of the broad market MSCI USA Index. In addition, its positive growth exposure — a measure of historical and future earnings growth — was nearly as consistent.
Despite their elevated valuations, the software and services industry outpaced the broad market by a cumulative 150% over the past decade and the momentum exposure increased commensurately. Given those exposures, many value strategies may have underweighted this industry, which in turn would have hurt their active returns.
The article first appeared on MSCI blog.
[ajax_load_more]